Interpreting market movements in a whole new way
Interpreting market movements in a whole new way
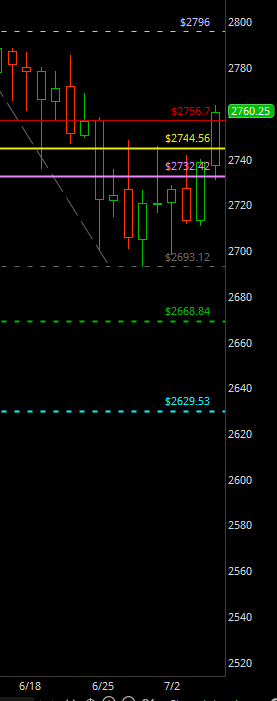
 The price action today, although on lower volume appears to be bullish for the markets and as a traders who should be unphased by sentiments, we have to look at the technical move and assess if this is in fact the end of the 2700 curse where we have ranged for a good 45 days now. In my opinion (which matters less), I think we will have some news overseas that moves us back into that range and keep us in the 2700 space a tad bit longer into the summer. Technically, we are looking nicely bullish and setting up for a nice move higher at least into the 2780 area. But at TradeGuidance, we trade to setups that we pull together for over 24 markets twice each day. Take a look at the Globex setup from last night (below) which we carried safely forward into the day session today. Traders taking long trades on YM ES and NQ reaped gains. At the end of the day, it is not what we think that matters but what we analyze given the market moves. Give us a try - email us at info@tradeguidance.com and we will make the simple committment of improving your trading consistency whether you are an intraday or swing trader.
