Interpreting market movements in a whole new way
Interpreting market movements in a whole new way
This edition for trading week ending Friday May 28, 2021.
A. Summarization of this past week's market and forward looking thoughts
We started the week with the S&P less than 2% from the all-time high [4238.04] while the NASDAQ entered trading on Monday on what was the largest four-week losing streak. Many analysts including me, were looking for a "correction" in the S&P and I was convinced in the initial part of the week that we would breach the key 4000-levels with the markets and had called the futures price action lower since about Tuesday and that did not disappoint. Monday's market action was typical after a brisk 2-day rally with the S&P nearing the old high. A downside test, then a rally, then more downside probing during the day that eventually saw the index close down 0.25%. As the week went on, the market then did what it does best. After frustrating bearish participants for a couple of days, bottom seekers and buyers got their turn in the barrel. Participants watched an undecided group of investors keep the S&P in a narrow trading range, right before the market went into complete risk-off mode. As trading began on Wednesday, it was funny to hear many of the media analysts looking for the reason why the market was ready to sell off. The stock market needs no specific reason on any particular day to conduct business. However, the "tax rhetoric" is being ramped up and it's sure to start impacting the mindset of investors.
Institutional participation usually however relies on proven technical indicators and off the daily charts of the broad markets which I show under the “market technical analysis” below, the 20-period simple moving average still sits above the longer-term 50-period average. The story with the price movement in the early part of the week set the stage for what transpired for the rest of the trading week. The up one hour, down the next continued as the week progressed and Friday saw the best of it as we ran into the monthly options expiration window. The S&P closed about 17 points lower than last Friday, offering no clues as to what comes next. There isn’t much to go off daily charts for the broad market as the Nasdaq remains in a 4-week losing streak, with a small gain, but similar to the S&P was stymied at critical resistance levels.
In the April meeting of the FOMC, a number of participants suggested that if the economy continued to make rapid progress toward their stated goals, it might be appropriate at some point in upcoming meetings to begin discussing a plan for adjusting the pace of existing asset purchases. In this weeks' Fed watch, only Dallas Fed President Kaplan has wanted to push the taper discussion, so it's new information that "a number" of other FOMC officials want to start heading that direction in the coming meetings.
The National Association of Active Investment Managers (NAAIM) conducts a weekly survey of its members to gauge their exposure to the markets, ranging from being leveraged long (+200) to leveraged short (-200). In last week's survey, overall exposure dropped from 87.8 (nearly fully invested) down to 46.9 - the lowest level since last April. Up until last week, there was a credible argument that sentiment had become a bit too frothy, but there's nothing like a market sell-off to get investors back on their toes.
There are a sizeable group of investors, and advisors, who haven’t been through a true bear market. (This past March was not one of them by any means despite the pullback caused by comments from the Treasury Secretary about the possibility of an overheating too fast economy) After a decade-long bull-market cycle fueled by Central Bank liquidity; it is understandable why mainstream analysis believes markets can only go higher. What gets lost during bull cycles, and found in the most brutal of fashions, is the devastation caused to financial wealth during a “mean reversion” process. Over the next several weeks, or even months, the markets can extend the current deviations from the long-term mean even further. But that is the nature of every bull market peak and bubble throughout history as the seeming impervious advance lures the last of the stock market “holdouts” back into the markets.
B. Market Technical Analysis

June E-mini S&P 500 Index futures were trading higher shortly after the mid-session on Friday, and for a brief period of time was actually trading higher for the week. The buying was strong early in the session but a drop in the technology sector put a lid on those gains. Gains were relatively broad across sectors on Friday. Sentiment received a boost Friday when it was reported that a gauge for U.S. manufacturing activity surged to a record high this month.
The main trend is up according to the daily chart. The trend turned up this past Friday when buyers took out the previous main top at 4179.50. A retracement ensued into the afternoon of monthly options expiration on Friday as tech sector gave up the initial gains and the Nasdaq led the pullback from early morning highs. This retracement although having the sentiment intact for continuation will likely lack the selling momentum needed to really cause a downward move which occurred earlier in the week. Only a move through 4055.50 will change the main trend to down. The short-term range is 4238.25 to 4029.25. The June Emini S&P futures is currently “hanging out” in its retracement zone between 4133.75 to 4158.50.
The main range has expanded and this expansion pushes the lower limits lower caused by revisitation of the market during Regular Trading Hours of untested or Virgin Points of Control. That expanded range is almost just under 200 points now and sits between 3843.25 and 4238.25. A 50-pont support zone now exists between 3994 and 4044. This zone is also controlling the short-term direction of the index.

Contributing to the early rally were shares of Nvidia, which jumped 3% after the chip giant announced a 4-for-1 stock split. The shares increased even though the split adds no actual value to the stock. In economic news, the IHS Markit Flash U.S. Manufacturing Purchasing Managers’ Index jumped to an all-time high of 61.5 in May from 60.5 in April. Economists polled by Dow Jones had expected the index to hold steady.
For the Emini Nasdaq for the upcoming week, attention is needed during RTH to the participant reaction to 13489.50 to 13625.00. Sellers appear still to be crowding in and making attempts to drive the tech sector valuation lower into the end of May whereas buyers such as institutional participants like Ark Investments will attempt to continue investing in growth names lining up the tech heavy Nasdaq and make an attempt to take it out in order to trigger a rally into a new high. The direction of the June E-mini NASDAQ-100 Index into the close is likely to be determined by trader reaction to 13489.50.
C. In terms of the Economic calendar for the upcoming week, here are some notable events:

D. Core sector performance for the trading week ending May 21st, 2021.
On a weekly basis here is the performance by sector:

E. Earnings for the trading week ending May 28th, 2021

F. How did our Futures trade idea perform last week’s trade ideas
In equity index futures, it is usually a re-entry back into the setups shown that did the trick this past week.

G. Futures trade ideas for the upcoming week
The futures trade ideas are preferable if traded as continuous contracts and held longer than the weekly time horizon if triggered with prices moving within the entry range.

Be careful with short trades in Soybean and Soybean Oil into this week and always wait for the grains market open into Monday to make a true determination of trend.
H. New stocks list for upcoming week(s)
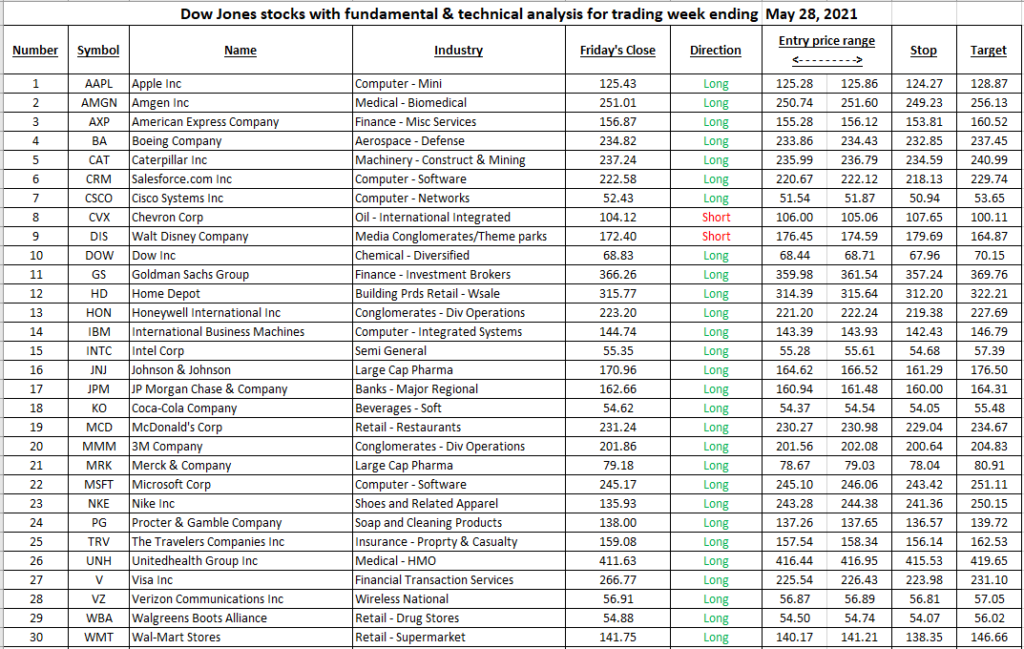
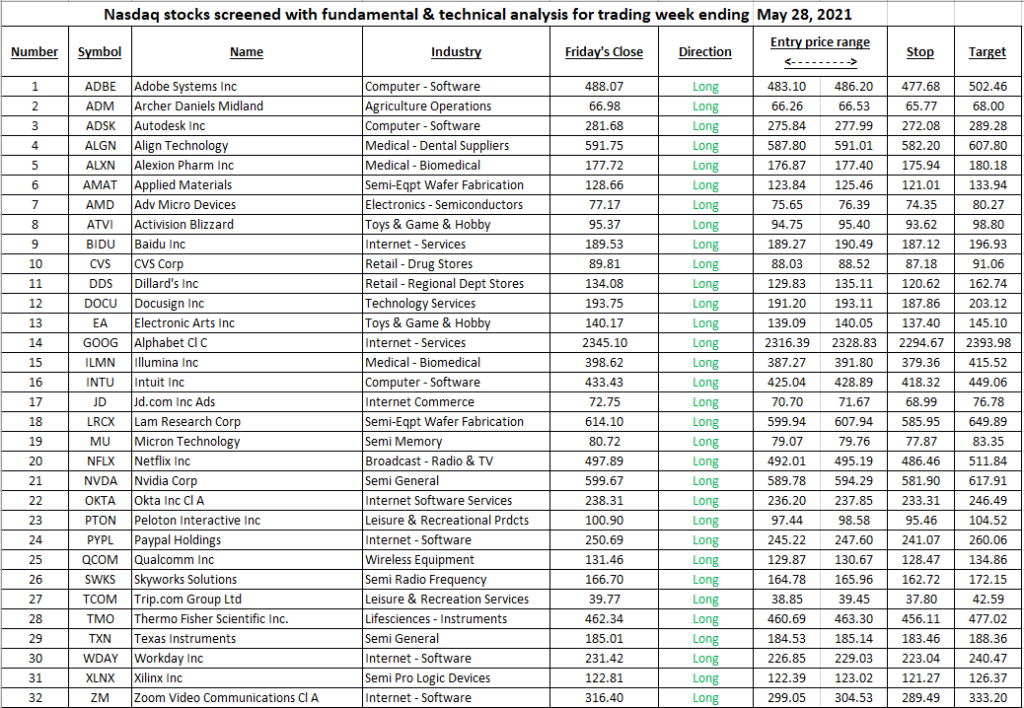
We continue our coverage of the Dow 30 names and the trending Nasdaq names in two distinct lists.

List # 2
We have changed a lot of names in this weeks analysis for the Nasdaq names.
