Interpreting market movements in a whole new way
Interpreting market movements in a whole new way
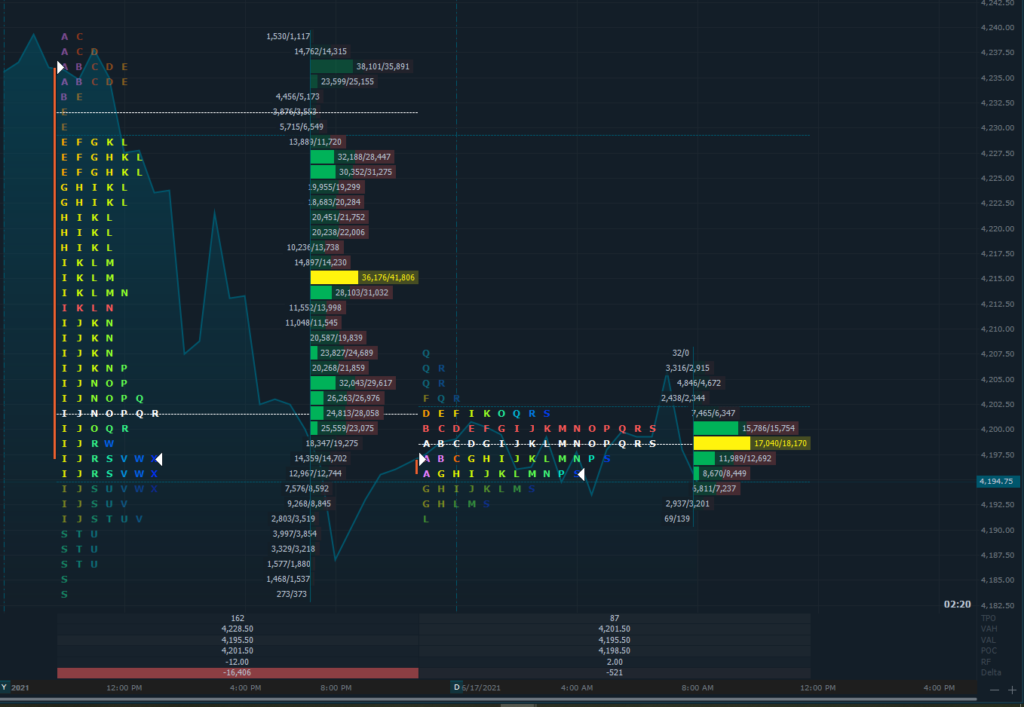
We introduce bit of a spin on the TPO chart for today which highlights the buy/sell volume in that fashion at TPO points. It also shows the aggregation for the RTH from yesterday and that split volume carries over to the RTH chart. The ON distribution is of more relevance in our conversation about market profile for today since after a major news event like the FOMC, it is interesting to gauge participation and sentiment following the news and how stops from longs contributed to the liquidation in the intraday yesterday and extending into the ON session. Sellers can pick up here at 4198 so we could see some more devaluation in price taking us farther away from ON Fibonacci resistance level [4218.50] as the RTH evolves. The greenback today has tagged on some more gains from the overnight price action and at the time of this writing around 8 am, the $DXY is trading at about 91.800 about +0.70. Markets historically have usually taken at least a session or more to establish direction after full Central Bank meetings and economic revelations. Inflation remains a worry for economists as it is now well above previous thresholds defined by the Fed.
Possible Scenarios
Key Levels to factor for the intraday price movement.

TPO Chart
