Interpreting market movements in a whole new way
Interpreting market movements in a whole new way
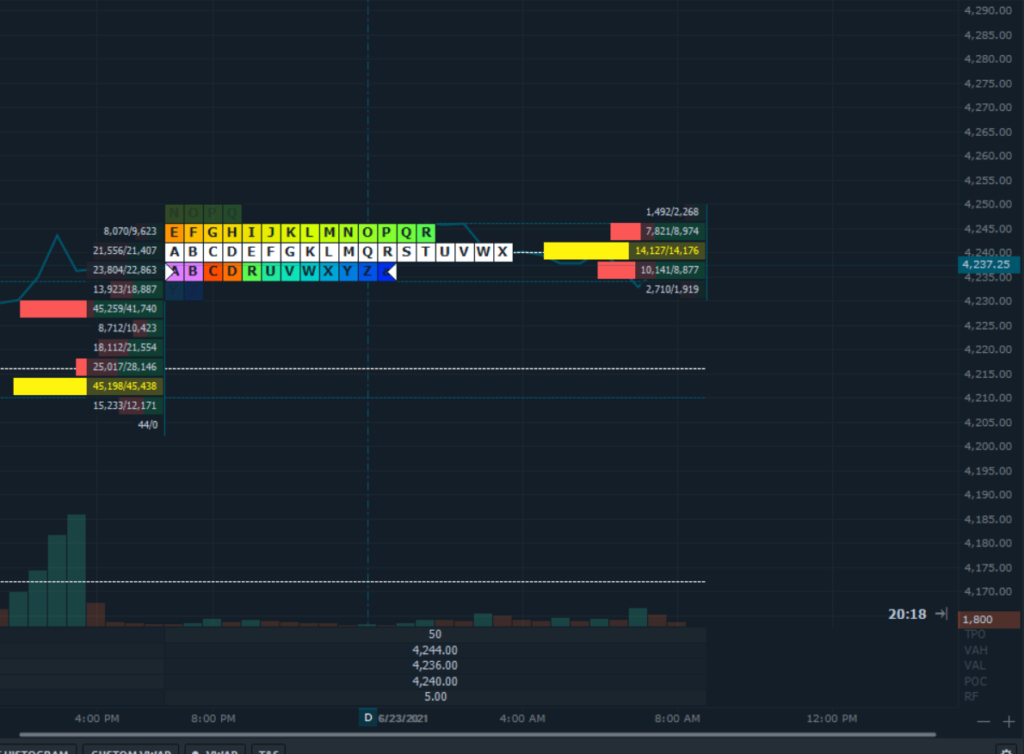
Ironically, the dead cat bounce some analysts were talking about on here about the broad market in fact, in our opinion applies more to cryptos as bitcoin futures see a resurrection in price indicative of having perhaps found an interim bottom. We will have to see. Meanwhile, in this early posting of the market profile summary, Emini S&P futures at the time of this writing is virtually flat after having pulled back from the ON high of 4248.25. Futures opened at 4237.50 yesterday after the post-settlement close and price is hovering right around that area having clocked a low of 4231 which is also just above the Fib halfback which is now at 4227. ON participation remains thin through the European open and as it has been customary in the past few days, European participation always goes net short on a futures gap up. Buyers however outnumber Sellers since the futures open at 6 pm yesterday into about 7:15 am today. With the stall in the overnight session at 4248.25, we now have value virtually unchanged a little past 8 am in the morning and futures are flat and therefore at this time there is no gap to talk about.
Possible scenarios and outline for trade positioning
Key Levels to factor for the intraday price movement.

TPO Chart
