Interpreting market movements in a whole new way
Interpreting market movements in a whole new way
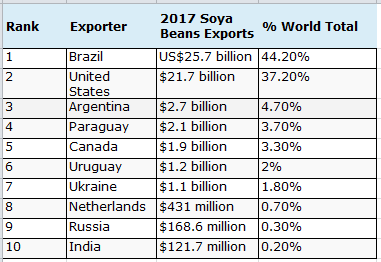
The US is the second largest exporter of Soy Beans in the world, second only to Brazil which continues to exhibit a surplus in the grain and threatens to scoop up available import capacity. Soybean prices have fallen sharply since the beginning of the year. Earlier this year in February, we saw a peak in prices thus far for the year clocking in at 1082.25 and while remaining through May’18 above 1060, we dropped sharply following the trade disagreements. Yes, with Soybeans we do have a lot to lose if we pick a trade war with China as China is the world’s largest importer of Soybeans and Brazil is always looking to gain market share.
At TradeGuidance, we do technical analysis while providing some information on fundamentals that is meant to help your farmers who are looking to hedge or otherwise balance your financial well-being. So who are the producing/exporting and consuming nations, let’s take a quick look:

We market and sell to our trading partners. China, Mexico, Japan, Spain, Indonesia, Thailand, Germany among others rank in the top importing nations. We have a surplus and we make some real nice product here in the US and our crop has the top yield in the world. We need to keep this market share and pick our battles. The economy in the mid-west US depends big time on our Soybean farmers and they help balance our nation’s trade.
So here is a technical analysis of price, not discounting factors like weather and other environmental factors that affect the overall crop output. Analyzing price over a 3-year horizon puts the peak price on June 10th 2016 at 1208.5. We hit recent lows in July at 826.25. Technically over this period we remain bearish below 1062.75 with a 3-8 month price target in the $737 area. Will we get there tomorrow, no! Prices evolve over a period of time and technical analysis is rarely wrong.
For the short-term however, we are on an up cycle and will find support in the 863.25 area while seeking out a profit target of 946.25.