Interpreting market movements in a whole new way
Interpreting market movements in a whole new way
We know that a lot of you like to trade the index futures. Trading the Emini S&P (ES) can be a daunting task in the type of volatile markets we saw in the beginning of the year. Market partcipation was high but a lot of traders saw their accounts shrink from panic in the markets leading to window dressing by managed money that adds to the head winds. Markets however, move for a reason. They are compelled to follow critical price levels and therefore historically repeat through price patterns over time and being caught in a move or a squeeze is never pretty especially if you are a retail trader.
Take today's price action thus far for example. The news on Chinese retaliatory tariffs is not generating the excitement or panic that traders are expecting. The ES fills its gap at 2827 and continues on in its usual bipolar fashion shaking out retail traders. If you call this trading - you need to reeducate yourself and begin to trade to rules by allowing trades to come to you versus chasing red and green bars all day.
In this posting, we do a short-term analysis of both the Emini S&P [ES] and the Emini Dow [YM] for you readers. Beginning September and as the futures roll to the front-quarter (December), market participation increases. What should we expect leading into this period?
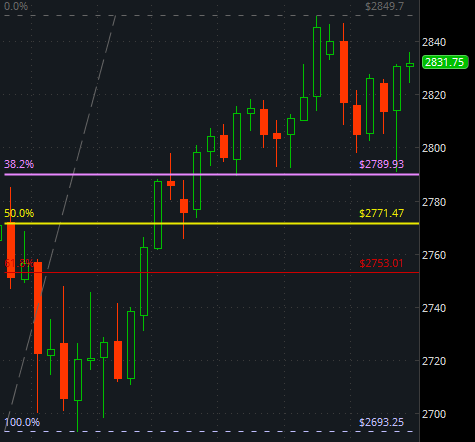
A review of the chart of the ES below from the low we made on June 28 to the high we made on July 25 puts a retrace to 2771.50 area a very realistic assumption. So is this a short setup? The indices are in a massive extension long from 2013 so essentially, this is nothing but a pullback trade to that entry long and I would think there is nothing wrong with trading pullbacks.
Here is the ES Chart that supports our analysis

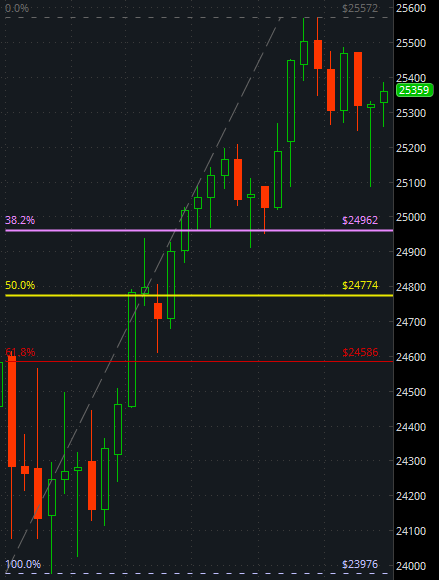
For the Emini Dow [YM], we have a similar study that measures the possible move between the same time periods. The YM ironically a much more technically sound instrument when it comes to trading, whether it be intraday or over a weekly timeframe. As compared to the ES, it does way lesser of the revisit of a price zone within a measured time interval.
Here is the YM Chart that supports our analysis

If you like this type of analyis drop us a note. Visit us at www.tradeguidance.com and fill out the contact form and ask us how we could perhaps help you with your trading goals and how low our cost is for what we cover for traders in terms of analysis.